October 2026 CPI Explained: Why There Is No 12-Month Inflation Rate and What It Means
The Bureau of Labor Statistics says prices rose 0.4% in October, but a gap in last year's data means most 12-month rates are missing. Here is what that means.
In this article 8 sections
The October 2026 CPI rose 0.4% from September, the Bureau of Labor Statistics (BLS) reported on November 10. BLS could not publish most 12-month rates, because it collected no October 2025 survey data during a government funding lapse. Any yearly figure you see for October is therefore an outside estimate, not an official number.
This explainer walks through what the October 2026 CPI report says, why the usual annual rate is missing, and how analysts fill the gap. It is written for anyone who saw a headline about hot inflation and wants to know what is solid and what is a guess.
At Seller Ideas, we try to separate the official figure from the commentary around it. In this report, that line matters more than usual.
What Did the October 2026 CPI Report Say?
The report says the Consumer Price Index for All Urban Consumers (CPI-U) rose 0.4% in October on a seasonally adjusted basis. That followed a 0.6% rise in September. Seasonally adjusted means the data is cleaned of regular calendar patterns, such as higher heating costs in winter.
Prices for shelter rose 0.3%. BLS says shelter made up over thirty percent of the monthly increase. Food rose 0.5%, and energy rose 0.7% after a 5.2% jump in September.
The core index, which leaves out food and energy, rose 0.3%. That matched the gains in September and August. Recreation, medical care, motor vehicle insurance, household furnishings, and education all moved up. Used cars and trucks, along with communication, were among the few major categories that fell.
| Category | September | October |
|---|---|---|
| All items | 0.6% | 0.4% |
| Food | 0.0% | 0.5% |
| Energy | 5.2% | 0.7% |
| All items less food and energy (core) | 0.3% | 0.3% |
These are monthly changes from the BLS October 2026 CPI news release. A month-to-month change is a small number, but it adds up fast. Prices that rise 0.4% every month would climb about 4.9% in a year. That compounding is the reason economists watch each monthly print closely.
Why Is There No 12-Month Inflation Rate for October 2026?
There is no official 12-month rate because BLS did not collect October 2025 survey data. The agency says a lapse in appropriations stopped data collection that month. For most CPI series, BLS could not publish October 2025 indexes, so it cannot compare October 2026 to a year earlier.

The yearly rate is the number most people quote. It compares today's price level with the same month last year. Without the October 2025 starting point, the math has nothing to compare against.
BLS publishes an online fact sheet on how it handles missing data. It also notes that the gap affects the indexes where October 2025 values are unavailable. Some series may still have a yearly figure, so check the BLS tables before you assume one is missing.
The gap is a real limit on what anyone can say with certainty. A headline that states an exact annual inflation rate for October is quoting an estimate. Treat it as one.
How Do Analysts Estimate the Yearly Rate Anyway?
Analysts estimate the yearly rate by filling the missing month with a reasoned guess, a process called interpolation. In its October analysis, KPMG's economists say the yearly gains had to be interpolated because of the six-week government shutdown a year ago. Their estimate is that CPI rose 4.2% from a year earlier, after 3.7% in September.
That estimate matters because of what it implies for paychecks. KPMG puts average hourly wage growth at an implied 3.1% for the month. If both numbers are close to right, prices are rising faster than wages. That helps explain why many employed people still feel like they are losing ground.
KPMG also looks at the three-month annualized pace, which is a better gauge of momentum. Annualized means taking the last three months and projecting the pace over a full year. By that measure, headline inflation ran at 5.7%, up from 4.6% in September. For core prices, the pace was 3.7%, up from 3.4%.
No single estimate is the final word. The three-month measure avoids the missing-month problem entirely, which is its main advantage. Its weakness is that three months of data can swing on a single volatile category such as gasoline.
What Is the Difference Between Headline and Core Inflation?
Headline inflation counts every item in the CPI basket. Core inflation removes food and energy, which can jump around from month to month. The Fed and most economists watch both, because each answers a different question.
Headline CPI tells you what households actually paid. Core CPI shows the underlying trend once weather, oil markets, and harvests settle down. In October, headline rose 0.4% and core rose 0.3%, so food and energy added a little extra heat.
The gap between the two is small this month. That is a clue in itself. When core alone runs at 0.3% for three months straight, the pressure is not coming only from gas stations and grocery aisles. It is spread across goods and services, which is the pattern that worries policymakers most.
One more term is worth knowing: "super core." It covers services excluding shelter and energy services. KPMG reports that this measure rose 0.4% in October, the same as in September, with recreation services such as sporting events, concerts, and streaming leading the way.
Where Did Prices Rise the Most in October?
Prices rose the most in food, energy services, and household goods. According to KPMG, food prices rose 0.5%, the fastest pace since April. Food at home rose 0.4%, and food away from home rose 0.5%.
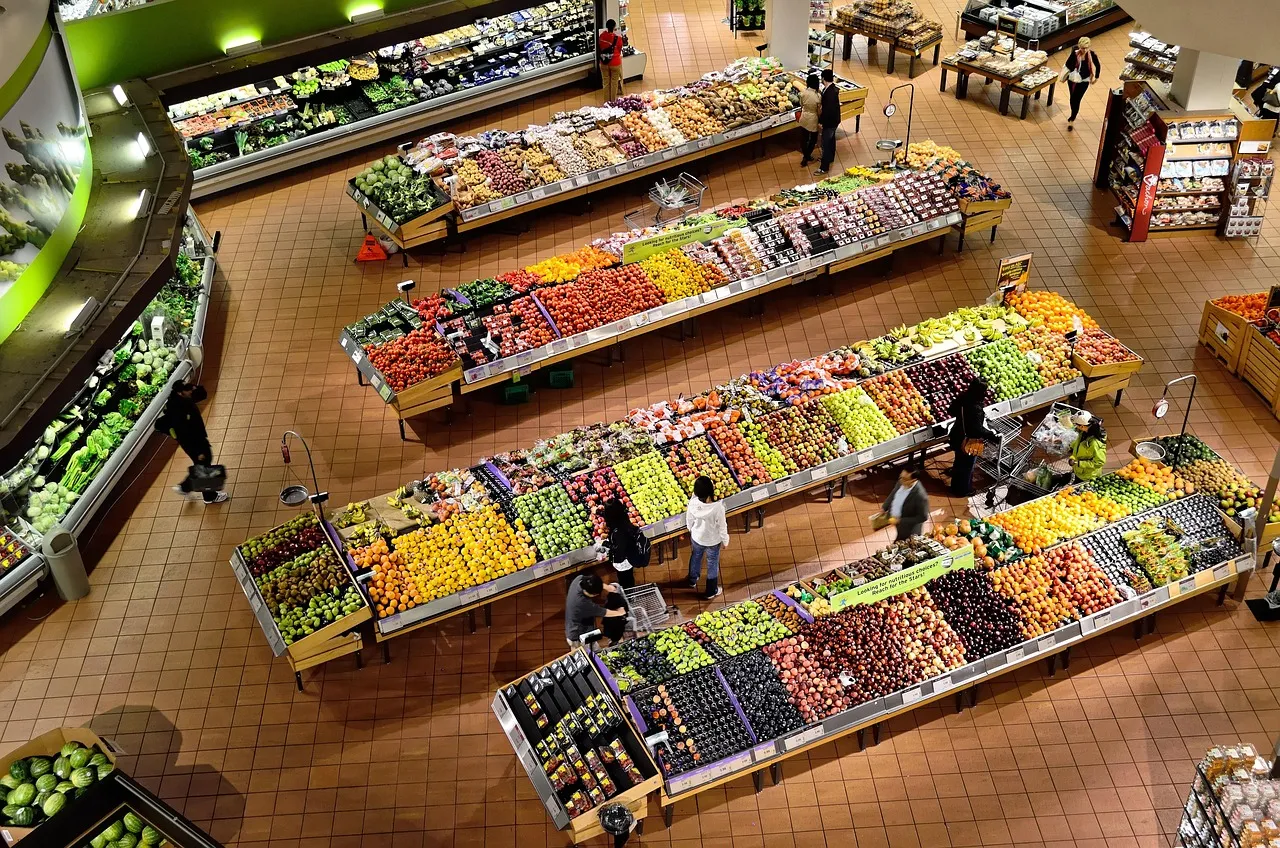
Some individual items stood out. KPMG reports that baby formula rose 5.1%, which it calls the largest increase on record. Snacks rose 1%, and beef rose 0.9%. For a broader look at the grocery side of this story, see our explainer on why grocery prices still feel high in 2026.
Energy told two stories. Gasoline cooled to a rise of about 1% after a surge of more than 9% in September, according to KPMG. Electricity rose 0.9% and fuel oil rose 2.0%, so household energy bills still climbed.

On the goods side, appliances rose 1.3% and furniture rose 1.2%. The one big offset was used vehicles, where prices fell as demand weakened. That is a useful reminder that a single headline number hides large moves in both directions.
The same price pressure is showing up in stores. Our look at the 2026 holiday sales forecast shows how higher goods prices account for roughly half of the projected growth in holiday spending.
Does the October CPI Mean the Fed Will Raise Rates in December?
Not automatically. The Federal Reserve makes that call, and it looks at more than one report. Still, KPMG's headline says October inflation cinches a December rate hike, which shows how strongly some analysts read the data.
The logic is simple. The Fed raises its benchmark interest rate to slow borrowing and spending. When core inflation runs at 0.3% a month for three months in a row, that is above the pace consistent with stable prices. KPMG notes that 0.3% is 0.1 percentage point above the level needed for price stability.
For background on the Fed's most recent decisions, read our explainer on what the October meeting means for your money. Our piece on the 2026 Nobel Prize in Economics explains why expectations about future inflation matter so much to rate decisions.
A rate hike would affect credit card rates, auto loans, and savings account yields. Borrowers would likely pay more, and savers would likely earn more. The exact path depends on what the Fed decides, not on any one analyst's forecast.
What Should Households Do With This Information?
Treat the October report as a signal about direction, not a precise measure of your own costs. Your personal inflation rate depends on what you actually buy. A renter, a commuter, and a retiree can all face very different price changes.
These steps follow from the data:
- List your five biggest monthly bills and note which ones rose recently.
- Check any variable-rate debt, since rate hikes hit it first.
- Compare grocery prices across stores, especially for beef, snacks, and baby products.
- Look at your savings account rate, and move money if yours trails the market.
The next official data point arrives soon. BLS is scheduled to release the November CPI on December 10, 2026, at 8:30 a.m. Eastern. That report will show whether October was a bump or a trend.
Conclusion
The October 2026 CPI shows prices rising 0.4% in a month, with core prices steady at 0.3%. The official yearly rate is missing for most items because of an old data gap. Estimates fill the hole, but they are estimates.
Seller Ideas checked the monthly figures against the BLS release and the analyst commentary against KPMG's published analysis. The practical takeaway is simple. Watch the monthly numbers, check your own bills, and wait for the December 10 release before drawing big conclusions.